Compliance snapshot
Source: EPA ECHO, SDWA data download (release 2026-10-14) · Violations that began 2021–2025
How many violations?
Who is served? How fast is it fixed?
What stands out?
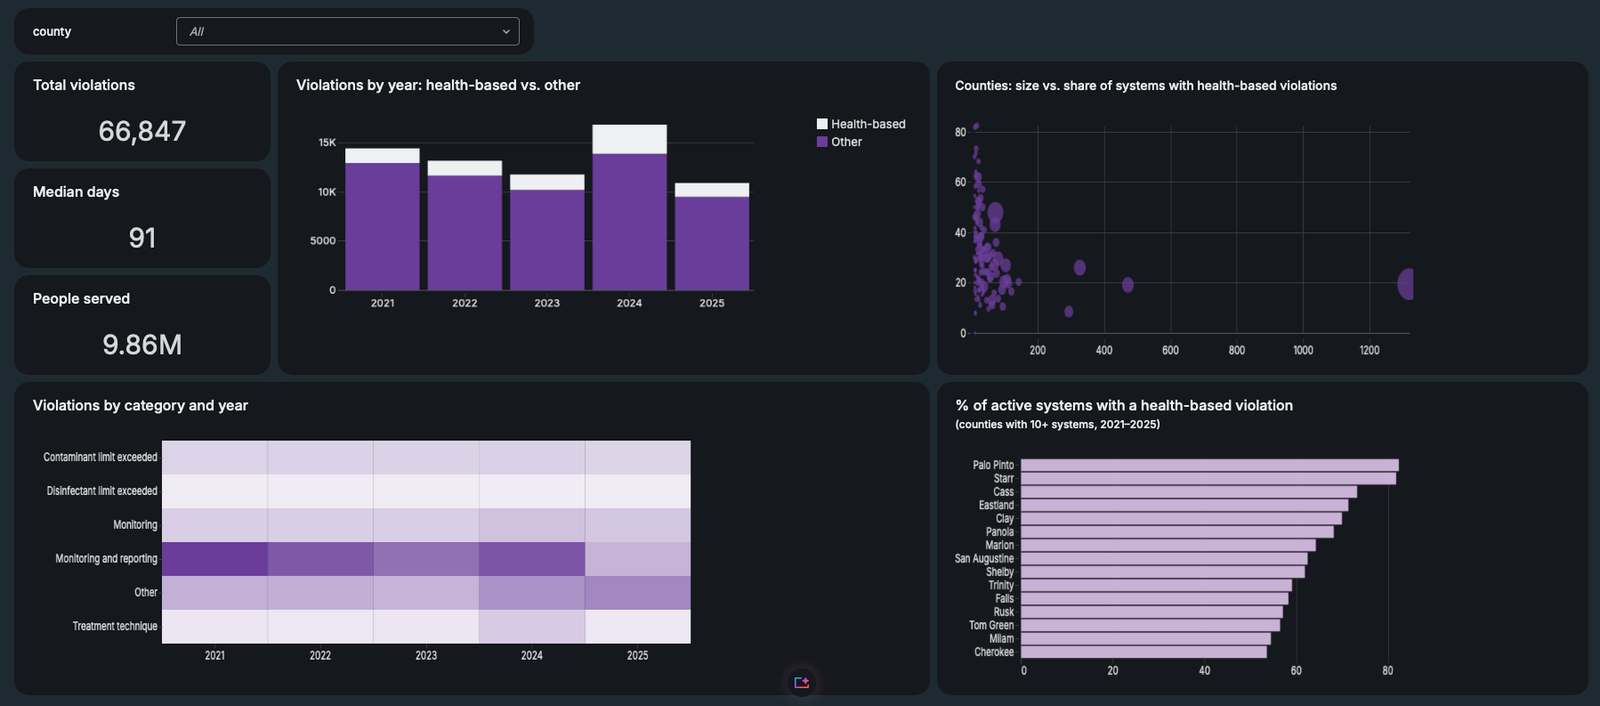
* Regulatory compliance, not water safety. "People served" is each active community system's population, counted once, not people exposed to a problem.
Pipeline
Medallion architecture on Unity Catalog · Lakeflow Job, monthly · Full run ~5 min on serverless
Original EPA files, unchanged.
/Volumes/…/landingTexas rows plus lineage.
sdwa_bronzeUnique, typed, no personal data.
sdwa_silverStar schema for analytics.
sdwa_goldDashboard with county filter.
LakeviewEngineering decisions
Preventing misleading numbers mattered more than any chart.
Deduplication
Violation + enforcement pairs inflated rows ~3.6×. 1,073,753 rows became 296,146 unique violations.
Quality checks
10,212 enforcement rows had no violation ID. They were kept out of violation counts.
Fair rankings
Counties need 10+ active systems to be ranked, so one system can't show 100%.
No double counting
Population counts each system once. Aggregations run before joins to avoid fan-out.
One county per system
4 systems serve more than one county. A fixed rule (MIN county) assigns each to one, so none is counted twice.
Databricks AI/BI dashboard
Annual trend · Category heatmap · County bubbles · County ranking
Next: Genie Q&A · household plumbing access (Census ACS) · wastewater compliance (EPA ICIS-NPDES).